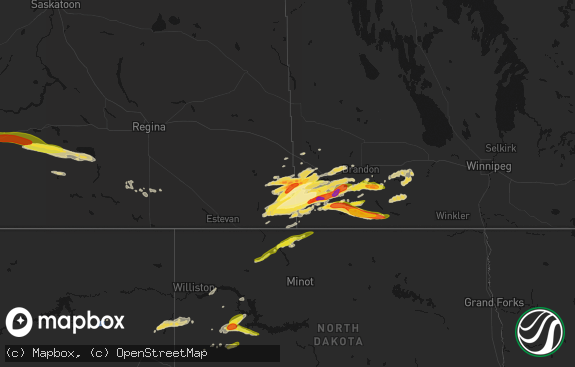
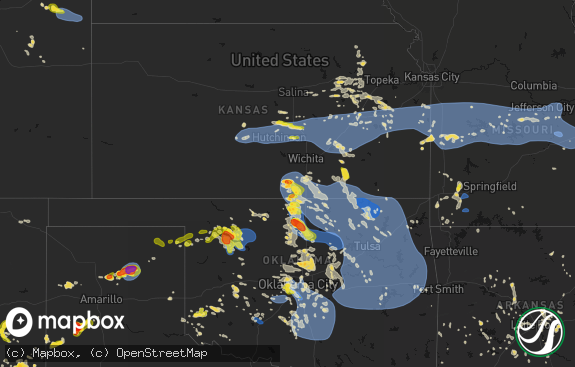
Hail Map in New Mexico on July 11, 2020

Get this storm
July 11 map
$229
one time, instant access
Download today. No call, no setup
Keep the $229
Bought the map and want the full workflow? Apply the entire $229 to a subscription within 7 days. None of it is wasted.
Every map, not just this one
This buys you this map. Subscription and you get every map we run, in the markets you choose from a few cities to whole states to nationwide. Plus real-time alerts the moment a storm fires.
Contact data
Name, contact info, occupancy, even credit band for addresses in the footprint. You go from where it hit to who to call.
Become the source they trust
Unlimited branding weather history reports on demand. You already have the documented answer ready for the property owner, and you are the one who showed up with it.
Property data and RoofTrace estimates
Pull up any address you have got, its value and the exact code rules for that jurisdiction, straight from One Click Code. Then RoofTrace estimates the squares, pitch, and roof value, priced the way you price.
Storm reports in New Mexico
New Mexico
| Date | Description |
|---|---|
| 07/11/20202:19 AM CDT | At 719 PM MDT, a severe thunderstorm was located over Tucumcari, moving northeast at 20 mph. HAZARD...60 mph wind gusts and half dollar size hail. SOURCE...Radar indicated. IMPACT...Hail damage to vehicles is expected. Expect wind damage to roofs, siding, and trees. Locations impacted include... Tucumcari, Logan and Ute Lake State Park. This includes the following highways... Interstate 40 between Mile Markers 323 and 353. State Road 104 between Mile Markers 94 and 105. |
| 07/11/20201:46 AM CDT | At 645 PM MDT, a severe thunderstorm was located 14 miles southeast of Mosquero, moving east at 20 mph. HAZARD...60 mph wind gusts and quarter size hail. SOURCE...Radar indicated. IMPACT...Hail damage to vehicles is expected. Expect wind damage to roofs, siding, and trees. This severe thunderstorm will remain over mainly rural areas of east central San Miguel, southeastern Harding and northern Quay Counties. |
| 07/11/202012:57 AM CDT | At 556 PM MDT, a severe thunderstorm was located near Des Moines, moving east at 10 mph. HAZARD...60 mph wind gusts and half dollar size hail. SOURCE...Radar indicated. IMPACT...Hail damage to vehicles is expected. Expect wind damage to roofs, siding, and trees. Locations impacted include... Des Moines and Grenville. This includes Highway 64 between Mile Markers 387 and 410. |
| 07/11/202012:16 AM CDT | At 516 PM MDT, severe thunderstorms were located along a line extending from near Farley to near Roy, moving east at 20 mph. HAZARD...60 mph wind gusts and quarter size hail. SOURCE...Radar indicated. IMPACT...Hail damage to vehicles is expected. Expect wind damage to roofs, siding, and trees. Locations impacted include... Roy, Abbott, Chicosa Lake State Park, Solano, Farley, Gladstone, Mills and Yates. |
| 07/10/202011:33 PM CDT | At 432 PM MDT, a severe thunderstorm was located 8 miles west of Mills, or 18 miles east of Wagon Mound, moving southeast at 20 mph. HAZARD...60 mph wind gusts and quarter size hail. SOURCE...Radar indicated. IMPACT...Hail damage to vehicles is expected. Expect wind damage to roofs, siding, and trees. Locations impacted include... Roy, Mills and Chicosa Lake State Park. |
| 07/10/202011:08 PM CDT | At 407 PM MDT, a severe thunderstorm was located 12 miles southeast of Springer, moving northeast at 10 mph. HAZARD...60 mph wind gusts and quarter size hail. SOURCE...Radar indicated. IMPACT...Hail damage to vehicles is expected. Expect wind damage to roofs, siding, and trees. Locations impacted include... Abbott. |
| 07/10/20207:58 PM CDT | A local report indicates 1.00 inch wind near 12 ENE BELL RANCH |
All States Impacted by Hail Map on July 11, 2020
Cities Impacted by Hail Map on July 11, 2020
- Laverne, OK
- Fulda, MN
- Tower Hill, IL
- Shelbyville, IL
- Locust Grove, OK
- Peggs, OK
- Ardmore, OK
- Madill, OK
- Iuka, IL
- Johnsonville, IL
- Red Oak, OK
- Alva, OK
- Eureka, IL
- Saybrook, IL
- Bellflower, IL
- Mahomet, IL
- Foosland, IL
- Fisher, IL
- Des Moines, NM
- Cadiz, KY
- Greencastle, IN
- Bainbridge, IN
- Miami, TX
- Perryton, TX
- Cambridge, IL
- Kewanee, IL
- Galva, IL
- Mineral, IL
- Sheffield, IL
- Annawan, IL
- Urbandale, IA
- French Lick, IN
- Cumberland Furnace, TN
- Vanleer, TN
- Charlotte, TN
- Leland, IL
- Waterman, IL
- Arrowsmith, IL
- Sibley, IL
- Gibson City, IL
- Ludlow, IL
- Elliott, IL
- Paxton, IL
- Decatur, IL
- North English, IA
- Garber, OK
- Waddy, KY
- Morrison, OK
- Nardin, OK
- Lamont, OK
- Erie, KS
- Saint Paul, KS
- Saint Anne, IL
- Glenwood, MN
- Starbuck, MN
- Gruver, TX
- Guymon, OK
- Goodwell, OK
- Blue Grass, IA
- Stockton, IA
- Walcott, IA
- Davenport, IA
- Parkersburg, IA
- Wellsburg, IA
- Potomac, IL
- Wolcott, IN
- Reynolds, IN
- Chalmers, IN
- Shell Rock, IA
- Janesville, IA
- Clarksville, IA
- Allison, IA
- Cedar Falls, IA
- New Hartford, IA
- Moweaqua, IL
- Oswego, KS
- Longton, KS
- Elk Falls, KS
- Osceola, IA
- Stanley, IA
- Mapleton, MN
- Roanoke, IL
- Chenoa, IL
- Hudson, IL
- Minonk, IL
- Congerville, IL
- Gridley, IL
- Normal, IL
- Benson, IL
- Towanda, IL
- Carlock, IL
- El Paso, IL
- Washington, IL
- Lowpoint, IL
- Graymont, IL
- Metamora, IL
- Secor, IL
- Lexington, IL
- Flanagan, IL
- Bloomington, IL
- Mannford, OK
- Sand Springs, OK
- Watkins, IA
- Norway, IA
- Keystone, IA
- Van Horne, IA
- Lone Tree, IA
- Dysart, IA
- Atkins, IA
- Coralville, IA
- Walford, IA
- Tiffin, IA
- Amana, IA
- Newhall, IA
- Swisher, IA
- Fairfax, IA
- Garrison, IA
- North Liberty, IA
- Oxford, IA
- West Liberty, IA
- Iowa City, IA
- Westmoreland, KS
- Wamego, KS
- Enid, OK
- Fairmont, OK
- Waukomis, OK
- Lahoma, OK
- Lyle, MN
- Stacyville, IA
- Adams, MN
- Osage, IA
- Saint Ansgar, IA
- McIntire, IA
- Little Cedar, IA
- Rose Creek, MN
- Riceville, IA
- Altamont, IL
- Effingham, IL
- Shumway, IL
- Beecher City, IL
- Clinton, IN
- Neodesha, KS
- Benedict, KS
- Thayer, KS
- Chanute, KS
- Altoona, KS
- Atkinson, IL
- Okeene, OK
- Hector, MN
- Bird Island, MN
- Danvers, MN
- Buffalo Lake, MN
- Lake Lillian, MN
- Raymond, MN
- Brownton, MN
- Pennock, MN
- Lafayette, MN
- Benson, MN
- Kerkhoven, MN
- Murdock, MN
- Clontarf, MN
- Olivia, MN
- Winthrop, MN
- Gaylord, MN
- Gibbon, MN
- Willmar, MN
- Stewart, MN
- Blomkest, MN
- Fairfax, OK
- Ponca City, OK
- Burbank, OK
- Poteau, OK
- Hanlontown, IA
- Joice, IA
- Sallisaw, OK
- Pekin, IL
- Minier, IL
- East Peoria, IL
- Stanford, IL
- Groveland, IL
- Kenney, IL
- Creve Coeur, IL
- Beason, IL
- McLean, IL
- Mapleton, IL
- Armington, IL
- Mackinaw, IL
- Hopedale, IL
- Hanna City, IL
- Clinton, IL
- Morton, IL
- Peoria, IL
- Waynesville, IL
- Tremont, IL
- Atlanta, IL
- Sunray, TX
- Stratford, TX
- Primm Springs, TN
- Lyles, TN
- Nunnelly, TN
- Centerville, TN
- Duck River, TN
- Ames, OK
- Lyndon, IL
- Erie, IL
- Fenton, IL
- Prophetstown, IL
- Morrison, IL
- Fort Dodge, IA
- Otho, IA
- Duncombe, IA
- Waukon, IA
- Barnsdall, OK
- Pawhuska, OK
- Wynona, OK
- Geneseo, IL
- Watseka, IL
- Martinton, IL
- Central City, IA
- Coggon, IA
- Walker, IA
- Daisy, MO
- Friedheim, MO
- Sedgewickville, MO
- Woolstock, IA
- Salem, IN
- Campbellsburg, IN
- Orleans, IN
- Welda, KS
- Garnett, KS
- Westphalia, KS
- Mallard, IA
- Havelock, IA
- Sperry, OK
- McEwen, TN
- Harrodsburg, KY
- Cloverdale, IN
- Paris, IL
- Chrisman, IL
- Lawler, IA
- Waucoma, IA
- Fredericksburg, IA
- Sumner, IA
- New Hampton, IA
- Nelson, MN
- Carlos, MN
- Alexandria, MN
- Cedar Rapids, IA
- Palo, IA
- Fredonia, KS
- Elk City, KS
- Benton City, MO
- Mexico, MO
- Auxvasse, MO
- Yates Center, KS
- What Cheer, IA
- Sigourney, IA
- Jackson, MN
- Lakefield, MN
- Brewster, MN
- Okabena, MN
- Waterloo, IA
- Hudson, IA
- Owensboro, KY
- Waynoka, OK
- Norris City, IL
- Blackwell, OK
- Tonkawa, OK
- Dewey, IL
- Terre Haute, IN
- Isabella, OK
- Fairview, OK
- Ringwood, OK
- Dennis, KS
- Mound Valley, KS
- Cherryvale, KS
- Heltonville, IN
- Norman, IN
- Humboldt, KS
- Iola, KS
- McCune, KS
- Columbus, KS
- Chetopa, KS
- Miami, OK
- Parsons, KS
- Galesburg, KS
- Welch, OK
- Fairmont, MN
- Grove, OK
- Vera, OK
- Ramona, OK
- Collinsville, OK
- Rinard, IL
- Clay City, IL
- Cisne, IL
- Hereford, TX
- Dimmitt, TX
- Lake Park, IA
- Spirit Lake, IA
- Round Lake, MN
- Newton, IL
- Dundas, IL
- Ingraham, IL
- Cherokee, OK
- Watonga, OK
- Lorman, MS
- Independence, KS
- Coffeyville, KS
- Caney, KS
- Grenville, NM
- New Ulm, MN
- Sleepy Eye, MN
- Roland, IA
- Nevada, IA
- Story City, IA
- McCallsburg, IA
- Dennison, IL
- Vermilion, IL
- West Terre Haute, IN
- Riley, IN
- Goltry, OK
- Topeka, KS
- Dickson, TN
- Sabetha, KS
- Wetmore, KS
- Des Moines, IA
- Mena, AR
- Ralston, OK
- Marland, OK
- Chester, OK
- Hampton, IA
- Sheffield, IA
- Dubois, IN
- Indianola, IA
- Ackworth, IA
- Carlisle, IA
- Hazel Green, WI
- Kieler, WI
- Cuba City, WI
- Potosi, WI
- Gowrie, IA
- Veedersburg, IN
- Seymour, IN
- Anadarko, OK
- Attica, IN
- Romney, IN
- Westpoint, IN
- Wingate, IN
- New Richmond, IN
- Lafayette, IN
- Hillsboro, IN
- Waynetown, IN
- Hunter, OK
- Bloomfield, IN
- Battle Ground, IN
- Brookston, IN
- Remington, IN
- Watts, OK
- Colcord, OK
- Oskaloosa, KS
- Ozawkie, KS
- Baxter, IA
- Melbourne, IA
- Newton, IA
- Ames, IA
- State Center, IA
- Rhodes, IA
- Colo, IA
- Collins, IA
- Owasso, OK
- Oologah, OK
- Claremore, OK
- Neosho Falls, KS
- Le Roy, KS
- Maple Hill, KS
- Paxico, KS
- Eskridge, KS
- Harveyville, KS
- Hamburg, AR
- Big Sandy, TN
- Indian Mound, TN
- Dover, TN
- Switz City, IN
- Linton, IN
- Denison, KS
- Mayetta, KS
- Holton, KS
- Valley Falls, KS
- Vinita, OK
- Rose, OK
- Strang, OK
- Hulbert, OK
- Spavinaw, OK
- Tahlequah, OK
- Big Cabin, OK
- Salina, OK
- Adair, OK
- Pryor, OK
- Dalton City, IL
- Macon, IL
- Bethany, IL
- Milroy, MN
- Meno, OK
- Hennessey, OK
- Welling, OK
- Park Hill, OK
- Bunch, OK
- Cookson, OK
- Muldrow, OK
- Edna, KS
- Bluejacket, OK
- Altamont, KS
- Bartlett, KS
- Big Rock, TN
- Pawnee, OK
- Glencoe, OK
- Vermillion, KS
- Havensville, KS
- Danube, MN
- Amarillo, TX
- Freedom, OK
- Checotah, OK
- Gosport, IN
- Belvue, KS
- Olsburg, KS
- Hartland, MN
- Nowata, OK
- Saint Peter, MN
- Bloomington, IN
- Spencer, IN
- Burlingame, KS
- Milltown, IN
- Fredericksburg, IN
- Hardinsburg, IN
- Depauw, IN
- Dows, IA
- Galt, IA
- Tulsa, OK
- Osco, IL
- Sullivan, IN
- Conchas Dam, NM
- Mosquero, NM
- Sadorus, IL
- Wilmot, AR
- Litchfield, MN
- Heavener, OK
- Palestine, IL
- Flat Rock, IL
- Buffalo, OK
- Mooreland, OK
- Clarks Grove, MN
- New Richland, MN
- Ellendale, MN
- Carbon, IN
- Brazil, IN
- Teutopolis, IL
- Dieterich, IL
- Wheeler, IL
- Alamo, IN
- Crawfordsville, IN
- Sturgis, KY
- Boone, IA
- Woodward, IA
- Madrid, IA
- Grand Junction, IA
- Ogden, IA
- Tryon, OK
- Morrow, AR
- Prairie Grove, AR
- Canehill, AR
- Gore, OK
- Junction, IL
- Woodward, OK
- Springville, TN
- Garber, IA
- Colesburg, IA
- Guttenberg, IA
- Lehigh, IA
- Clare, IA
- Medford, OK
- Marshall, IL
- Wilburton, OK
- Tuskahoma, OK
- Quinton, OK
- Mechanicsville, IA
- Clay, KY
- Poland, IN
- Newkirk, OK
- Talala, OK
- Rolfe, IA
- Elizabeth, IN
- Laconia, IN
- Sheldon, IL
- Kankakee, IL
- Papineau, IL
- Donovan, IL
- Chebanse, IL
- Bonfield, IL
- Herscher, IL
- Clifton, IL
- Soldier, KS
- Delia, KS
- Orion, IL
- Lynn Center, IL
- La Grange, KY
- Waverly, KS
- Melvern, KS
- Lebo, KS
- Vincennes, IN
- Monroe City, IN
- Montgomery, IN
- Cumberland City, TN
- Burns, KS
- Newton, KS
- Chicago Heights, IL
- Corwith, IA
- Wesley, IA
- Henryetta, OK
- Shidler, OK
- Urbana, IL
- Seneca, KS
- Kincaid, KS
- Havana, KS
- Tyro, KS
- Wann, OK
- Swaledale, IA
- Dumont, IA
- Aredale, IA
- Solsberry, IN
- Freedom, IN
- Worthington, IN
- Olney, IL
- Noble, IL
- Fort Supply, OK
- El Reno, OK
- Muscatine, IA
- Lenapah, OK
- Niotaze, KS
- Sedan, KS
- S Coffeyville, OK
- Eureka, KS
- Fall River, KS
- Dearing, KS
- Copan, OK
- Severy, KS
- Howard, KS
- Lawrenceville, IL
- Bridgeport, IL
- Vinton, IA
- Hominy, OK
- Tipton, IA
- Windsor, IL
- Middle Amana, IA
- Kanawha, IA
- Grimes, IA
- West Des Moines, IA
- Clive, IA
- Windsor Heights, IA
- Eufaula, OK
- Alton, MO
- Doniphan, MO
- Stilwell, OK
- Uniontown, AR
- Pocola, OK
- Van Buren, AR
- Spiro, OK
- Arkoma, OK
- Roland, OK
- Dexter, KS
- Neponset, IL
- Woodlawn, TN
- Erin, TN
- Geary, OK
- Canton, OK
- Calumet, OK
- Okarche, OK
- Hitchcock, OK
- Southard, OK
- Longdale, OK
- Pampa, TX
- Clarendon, TX
- Groom, TX
- Fargo, OK
- Shattuck, OK
- May, OK
- Carmen, OK
- Balko, OK
- Dacoma, OK
- Gate, OK
- Bartlesville, OK
- Champaign, IL
- Bondville, IL
- Shellsburg, IA
- Dickens, IA
- Spencer, IA
- Terril, IA
- Ruthven, IA
- Onaga, KS
- Wilton, IA
- Moscow, IA
- Pendleton, KY
- West Baden Springs, IN
- Masonville, IA
- Oran, IA
- Aurora, IA
- Martelle, IA
- Alta Vista, IA
- Ryan, IA
- Hawkeye, IA
- Oelwein, IA
- Jesup, IA
- Fayette, IA
- Alburnett, IA
- Center Point, IA
- Maynard, IA
- Winthrop, IA
- Independence, IA
- Randalia, IA
- Marion, IA
- Tripoli, IA
- Readlyn, IA
- Westgate, IA
- Olin, IA
- Rowley, IA
- Fairbank, IA
- Lisbon, IA
- Hazleton, IA
- Quasqueton, IA
- Dunkerton, IA
- Springville, IA
- Anamosa, IA
- Elma, IA
- Stanwood, IA
- Dike, IA
- Holland, IA
- Brocton, IL
- Newman, IL
- Mountain Lake, MN
- Peoria Heights, IL
- Kensett, IA
- Northwood, IA
- Stewart, TN
- Auburn, KS
- Vallonia, IN
- Rensselaer, IN
- Georgetown, IL
- Dana, IN
- Rosedale, IN
- Montezuma, IN
- Hillsdale, IN
- Ridge Farm, IL
- Cayuga, IN
- Westville, IL
- Rockville, IN
- Danville, IL
- Mecca, IN
- Fredonia, KY
- Afton, OK
- Sanborn, MN
- Lamberton, MN
- Lucan, MN
- Marshall, MN
- Walnut Grove, MN
- Hurricane Mills, TN
- Waverly, TN
- Cushing, OK
- Ripley, OK
- Cement, OK
- Chickasha, OK
- Buckner, KY
- Crestwood, KY
- Broken Arrow, OK
- Catoosa, OK
- Carmi, IL
- Crossville, IL
- Victor, IA
- Ladora, IA
- Williamsburg, IA
- Cameron, OK
- Hackett, AR
- Bedford, IN
- Gracemont, OK
- Redwood Falls, MN
- Hampshire, TN
- Williamsport, TN
- Cassville, WI
- Brooklyn, IA
- Harris, IA
- Bushnell, IL
- Good Hope, IL
- Luana, IA
- Monona, IA
- Billings, OK
- Red Rock, OK
- Cresco, IA
- Lime Springs, IA
- Seiling, OK
- Oakwood, OK
- Marshall, IN
- Kingman, IN
- Waveland, IN
- Bloomingdale, IN
- South English, IA
- Smithfield, KY
- Porum, OK
- Saint Joseph, IL
- Ogden, IL
- Homer, IL
- Nicollet, MN
- Sunburg, MN
- Brooten, MN
- Nash, OK
- Pond Creek, OK
- Plover, IA
- Curlew, IA
- Perry, OK
- Reinbeck, IA
- Gladbrook, IA
- Grundy Center, IA
- Lincoln, AR
- Summers, AR
- Westville, OK
- Garnavillo, IA
- Glen Haven, WI
- Wagoner, OK
- Welcome, MN
- Mountain Park, OK
- Roosevelt, OK
- Fairmount, IL
- Dougherty, IA
- Rockwell, IA
- Marble Rock, IA
- West Union, IL
- Mason City, IA
- Clear Lake, IA
- Van Meter, IA
- De Soto, IA
- Earlham, IA
- Winterset, IA
- Stanhope, IA
- Kellogg, IA
- Maxwell, IA
- Randall, IA
- Jewell, IA
- Zearing, IA
- Radcliffe, IA
- Gilbert, IA
- Corydon, IN
- Williamsburg, MO
- Montgomery City, MO
- Thompson, MO
- Martinsburg, MO
- New Goshen, IN
- Belview, MN
- Aplington, IA
- Kesley, IA
- Ackley, IA
- New Smyrna Beach, FL
- Daytona Beach, FL
- Osteen, FL
- Maxwell, NM
- Raton, NM
- Amber, OK
- Skiatook, OK
- Fairfax, MN
- Spicer, MN
- New London, MN
- Atwater, MN
- Grove City, MN
- Tucumcari, NM
- Inola, OK
- Chouteau, OK
- Aline, OK
- Sulphur, OK
- Mannsville, OK
- Davis, OK
- Mill Creek, OK
- Wellston, OK
- Davenport, OK
- Stroud, OK
- Chandler, OK
- Carney, OK
- Rantoul, KS
- Ottawa, KS
- Mill Shoals, IL
- Longview, IL
- Savoy, IL
- Sidney, IL
- Philo, IL
- Tolono, IL
- Broadlands, IL
- Princeton, KY
- Eddyville, KY
- Seaforth, MN
- Wabasso, MN
- Clarion, IA
- Sparland, IL
- Chillicothe, IL
- Shelbyville, KY
- Mount Eden, KY
- Lawrenceburg, KY
- Salvisa, KY
- Webster City, IA
- Washington, IN
- Frankfort, KS
- Manly, IA
- Bancroft, IA
- Burt, IA
- Titonka, IA
- Lacona, IA
- Pleasantville, IA
- Knoxville, IA
- Milo, IA
- Melcher Dallas, IA
- Lanesville, IN
- Crandall, IN
- Ramsey, IN
- West Point, KY
- New Middletown, IN
- Georgetown, IN
- New Salisbury, IN
- Simpsonville, KY
- Mitchell, IN
- White Heath, IL
- Seymour, IL
- Mansfield, IL
- Colfax, IL
- Anchor, IL
- Villa Grove, IL
- Shoals, IN
- Burlington, OK
- Columbus, IN
- Freetown, IN
- Brownstown, IN
- Jeffers, MN
- Thornton, IA
- Stout, IA
- Fertile, IA
- Milford, IA
- Bingham Lake, MN
- Jay, OK
- Penfield, IL
- Farmington, KY
- Sedalia, KY
- Milan, IL
- Barnhill, IL
- Fairfield, IL
- Tecumseh, KS
- Grantville, KS
- Watson, IL
- Lakewood, IL
- Cowden, IL
- Wingo, KY
- Mayfield, KY
- Osage City, KS
- Lyndon, KS
- Hutchinson, MN
- Siloam Springs, AR
- Delaware, OK
- Farmer City, IL
- La Porte City, IA
- Granite Falls, MN
- Centerpoint, IN
- Odon, IN
- Loogootee, IN
- Crane, IN
- Haskell, OK
- Morris, OK
- Le Roy, IL
- Illiopolis, IL
- Warrensburg, IL
- Findlay, IL
- Latham, IL
- Harristown, IL
- Niantic, IL
- Mount Pulaski, IL
- Kandiyohi, MN
- Scranton, KS
- Kansas, OK
- Frankfort, IN
- Kaw City, OK
- Fairland, OK
- Speer, IL
- Princeville, IL
- Marion, KY
- Morganfield, KY
- Shawneetown, IL
- Burnt Prairie, IL
- McLouth, KS
- Tonganoxie, KS
- Cleo Springs, OK
- Fillmore, IN
- Coatesville, IN
- Dallas Center, IA
- Perham, MN
- Taft, OK
- Muskogee, OK
- Oktaha, OK
- Porter, OK
- West Salem, IL
- Mount Carmel, IL
- Browns, IL
- Bone Gap, IL
- Dalton, MN
- Elbow Lake, MN
- Noble, OK
- Norman, OK
- Heron Lake, MN
- Worthington, MN
- Moran, KS
- Colony, KS
- Williamsburg, KS
- Eagle Grove, IA
- Blairsburg, IA
- Panhandle, TX
- Brimfield, IL
- Nichols, IA
- Pana, IL
- Mode, IL
- Indianapolis, IN
- Mount Auburn, IA
- Hobart, IN
- Renwick, IA
- Algona, IA
- Belmond, IA
- Eucha, OK
- Helena, AR
- Lexa, AR
- Metcalf, IL
- Barrett, MN
- Elsmore, KS
- Savonburg, KS
- Kremlin, OK
- Jet, OK
- Helena, OK
- Carrier, OK
- Equality, IL
- Drummond, OK
- Revere, MN
- Mulberry, IN
- Rossville, IN
- Paoli, IN
- Marengo, IN
- English, IN
- Ninnekah, OK
- Rush Springs, OK
- La Fayette, IL
- Stinesville, IN
- Medora, IN
- Ellettsville, IN
- Unionville, IN
- Nashville, IN
- Emmetsburg, IA
- Dubuque, IA
- Roachdale, IN
- Dumas, TX
- Goodland, IN
- Brook, IN
- Ossian, IA
- Cynthiana, IN
- Owensville, IN
- Franklin, IN
- Bridgeton, IN
- Reelsville, IN
- Morley, IA
- Lamont, IA
- Truman, MN
- Gardner, IL
- Martinsville, IL
- Clayton, OK
- Kinta, OK
- Ceylon, MN
- Armstrong, IA
- Sherburn, MN
- Paris, TN
- Winslow, IN
- Oneida, KS
- Monticello, IL
- Albert Lea, MN
- Glenville, MN
- Holy Cross, IA
- Sherrill, IA
- Durango, IA
- Lane, KS
- Osawatomie, KS
- Petersburg, IN
- Fayette, MS
- Lincoln, IA
- Traer, IA
- West York, IL
- Fairbanks, IN
- Naylor, MO
- Oxly, MO
- Neelyville, MO
- Laura, IL
- Elmwood, IL
- Covington, OK
- Beech Grove, IN
- Whitestown, IN
- Zionsville, IN
- Brownsburg, IN
- Enfield, IL
- Warner, OK
- Trivoli, IL
- South Pekin, IL
- Manito, IL
- Green Valley, IL
- Delavan, IL
- Hartsburg, IL
- Glasford, IL
- Emden, IL
- Wakarusa, KS
- Carbondale, KS
- Arcola, IL
- Minnesota Lake, MN
- Wells, MN
- Waldorf, MN
- Stigler, OK
- Stendal, IN
- Oakland City, IN
- Patton, MO
- Perryville, MO
- Washburn, IL
- Pocahontas, IA
- Palmer, IA
- Mount Pleasant, TN
- Summertown, TN
- Marengo, IA
- Peabody, KS
- Williams, IN
- Clarksburg, MO
- California, MO
- Lewis, IN
- Shelburn, IN
- Jasonville, IN
- Farmersburg, IN
- Coalmont, IN
- Pimento, IN
- Oaktown, IN
- Carlisle, IN
- Bon Aqua, TN
- Ochelata, OK
- Pocasset, OK
- Minco, OK
- Cedar Vale, KS
- Decker, IN
- Hazleton, IN
- Norwalk, IA
- Prole, IA
- Sullivan, IL
- Montrose, IL
- Maroa, IL
- Mt Zion, IL
- Boody, IL
- Assumption, IL
- Stewardson, IL
- Blue Mound, IL
- Strasburg, IL
- Chestnut, IL
- Council Hill, OK
- Waseca, MN
- Delta, IA
- Crown Point, IN
- Merrillville, IN
- Windom, MN
- New Virginia, IA
- Lucas, IA
- Woodburn, IA
- Bunceton, MO
- Wanette, OK
- Asher, OK
- Callender, IA
- Toulon, IL
- Cosmos, MN
- Goldfield, IA
- Swea City, IA
- Saint George, KS
- Hume, IL
- Collison, IL
- Fithian, IL
- Avoca, IN
- Oolitic, IN
- Springville, IN
- Webbers Falls, OK
- Coweta, OK
- Boynton, OK
- Redbird, OK
- Fort Gibson, OK
- Stillwater, OK
- Clay City, IN
- Bowling Green, IN
- Pesotum, IL
- Nashoba, OK
- Xenia, IL
- Franklin, TN
- Eva, TN
- Hohenwald, TN
- Herndon, KY
- Santa Fe, TN
- Fort Campbell, KY
- Columbia, TN
- Palmyra, TN
- Gracey, KY
- Hopkinsville, KY
- New Johnsonville, TN
- Bumpus Mills, TN
- Only, TN
- Culleoka, TN
- Tennessee Ridge, TN
- Belmont, WI
- Darlington, WI
- Carnegie, OK
- Owatonna, MN
- Echo, MN
- Proctor, OK
- Woodhull, IL
- Rock Island, IL
- Thorntown, IN
- Lebanon, IN
- Dent, MN
- Mcalester, OK
- Hartshorne, OK
- Oklahoma City, OK
- Ayrshire, IA
- Silver Lake, KS
- Rossville, KS
- Huntingburg, IN
- Ferdinand, IN
- Cleveland, MN
- Le Sueur, MN
- Deltona, FL
- Port Orange, FL
- Calhoun, KY
- Utica, KY
- Livermore, KY
- Kellyville, OK
- Bristow, OK
- La Harpe, KS
- Blue Mound, KS
- Vassar, KS
- Mattoon, IL
- Maple City, KS
- Birch Tree, MO
- Ankeny, IA
- Waukee, IA
- Perry, IA
- Polk City, IA
- Granger, IA
- Bouton, IA
- Johnston, IA
- Minburn, IA
- Sherrard, IL
- Skellytown, TX
- Centralia, MO
- Coldwater, KS
- Lucien, OK
- Deer Creek, OK
- Prue, OK
- Douglas, OK
- Amorita, OK
- Beaver, OK
- Bixby, OK
- Wakita, OK
- Williamsfield, IL
- Victoria, IL
- Tilton, IL
- Catlin, IL
- Perrysville, IN
- Poseyville, IN
- Sidell, IL
- Allerton, IL
- Clutier, IA
- Okoboji, IA
- West Bend, IA
- Hanna, OK
- Illinois City, IL
- Overbrook, KS
- Lawrence, KS
- Albion, IL
- Gilmore City, IA
- Blue Rapids, KS
- Carpenter, IA
- Grafton, IA
- New Haven, IL
- Coal Valley, IL
- Lincoln, IL
- Fairview, TN
- Dayton, IA
- Miltona, MN
- Fort Pierce, FL
- Cumming, IA
- Somers, IA
- West Branch, IA
- Mount Vernon, IA
- Ely, IA
- Hollandale, MN
- Ridgeway, IA
- Calmar, IA
- Cottage Grove, TN
- Mason City, IL
- New Holland, IL
- Middletown, IL
- Bicknell, IN
- Bruceville, IN
- Colona, IL
- Patricksburg, IN
- Thomasboro, IL
- Lacon, IL
- Altona, IL
- Bradford, IL
- Putnamville, IN
- Downs, IL
- Wyoming, IL
- Bishop Hill, IL
- Oakwood, IL
- Tampico, IL
- Rantoul, IL
- Hooppole, IL
- Henry, IL
- Indianola, IL
- Universal, IN
- Russellville, IN
- Cory, IN
- Coal City, IN
- Ellsworth, IL
- Staunton, IN
- Covington, IN
- Edwards, IL
- Manchester, IA
- Delaware, IA
- Delhi, IA
- Eckerty, IN
- Birdseye, IN
- Taswell, IN
- Drakesboro, KY
- Rochester, KY
- Beaver Dam, KY
- Sims, IL
- Goshen, KY
- Puryear, TN
- Henry, TN
- Burden, KS
- Winfield, KS
- Farmersburg, IA
- Saint Olaf, IA
- Burlington, KS
- Burns, TN
- Indianola, OK
- Jewett, IL
- Stratford, IA
- Buchanan, TN
- Sapulpa, OK
- Janesville, MN
- Kamrar, IA
- New Concord, KY
- Dunlap, IL
- Edelstein, IL
- New Liberty, IA
- Lowden, IA
- Prairieburg, IA
- Brandon, IA
- Taopi, MN
- Clarence, IA
- Elkton, MN
- Dixon, IA
- Urbana, IA
- Ionia, IA
- Wheatland, IA
- Austin, MN
- Calamus, IA
- Durant, IA
- Atalissa, IA
- Bennett, IA
- Livermore, IA
- Redmon, IL
- Kansas, IL
- Okmulgee, OK
- Rockwell City, IA
- Harcourt, IA
- Paton, IA
- Ormsby, MN
- Saint James, MN
- Butterfield, MN
- Kinmundy, IL
- Fairbury, IL
- Cleveland, OK
- Osage, OK
- Buffalo, KS
- Waldron, AR
- Natural Dam, AR
- Evansville, AR
- Piqua, KS
- Hartford, AR
- Fort Smith, AR
- Centertown, KY
- Richmond, KS
- Laurens, IA
- Mount Vernon, IN
- Providence, KY
- Ridgway, IL
- Uniontown, KY
- Omaha, IL
- Cave In Rock, IL
- Grand Chain, IL
- Karnak, IL
- Metropolis, IL
- Morgan, MN
- Lecompton, KS
- Golden Gate, IL
- Bagley, WI
- Smithville, OK
- La Center, KY
- Wickliffe, KY
- Earlville, IA
- Postville, IA
- Decorah, IA
- Byars, OK
- Sharon, OK
- Ivesdale, IL
- Stratford, OK
- Roff, OK
- Ada, OK
- Wister, OK
- Talihina, OK
- Humboldt, IA
- Webb, IA
- Albert City, IA
- Marathon, IA
- Moorland, IA
- Manson, IA
- Palmersville, TN
- Mustang, OK
- Yukon, OK
- Hillsdale, IL
- Port Byron, IL
- Marion, KS
- Hillsboro, KS
- Boonville, MO
- Danvers, IL
- Gifford, IL
- Armstrong, IL
- Rankin, IL
- Madison Lake, MN
- Hartford, IA
- Swan, IA
- Baileyville, KS
- Oakland, IL
- Delphi, IN
- Barnes City, IA
- Rose Hill, IA
- Deep River, IA
- Hartwick, IA
- Guernsey, IA
- Cooksville, IL
- Mapleton, KS
- Quenemo, KS
- Courtland, MN
- Lowry, MN
- Hazel, KY
- Murray, KY
- Hatfield, AR
- Cove, AR
- Pilot Mound, IA
- Bokoshe, OK
- Glencoe, MN
- Cylinder, IA
- Lyons, IN
- Elgin, IA
- Fort Atkinson, IA
- Sacred Heart, MN
- Renville, MN
- Port Gibson, MS
- Yale, OK
- Braman, OK
- Glenpool, OK
- Mounds, OK
- Beggs, OK
- Kiefer, OK
- Jenks, OK
- Cedarville, AR
- Howe, OK
- Hodgen, OK
- Shady Point, OK
- Whitesboro, OK
- Honobia, OK
- Muse, OK
- Canadian, OK
- Haileyville, OK
- Maysville, OK
- Wheatland, OK
- Bethany, OK
- Tuttle, OK
- Washington, OK
- Union City, OK
- Macomb, OK
- Maud, OK
- Wynnewood, OK
- Shawnee, OK
- Purcell, OK
- Wayne, OK
- Paoli, OK
- Tecumseh, OK
- Pauls Valley, OK
- Piedmont, OK
- Kingfisher, OK
- Newcastle, OK
- Dougherty, OK
- Choctaw, OK
- Lexington, OK
- Mcloud, OK
- Lindsay, OK
- Newalla, OK
- Konawa, OK
- Omega, OK
- Greenfield, OK
- Saint Joseph, MN
- Benson, AZ
- Dragoon, AZ
- Lake Crystal, MN
- Mankato, MN
- Elysian, MN
- Eagle Lake, MN
- Kasota, MN
- Pemberton, MN
- West Lafayette, IN
- Buck Creek, IN
- Scottsburg, IN
- Palmyra, IN
- Pekin, IN
- New Albany, IN
- Floyds Knobs, IN
- Clarksville, IN
- Greenville, IN
- Sellersburg, IN
- Jeffersonville, IN
- Borden, IN
- Bronson, KS
- Hoyt, KS
- Wyandotte, OK
- Pontiac, IL
- Huachuca City, AZ
- Sierra Vista, AZ
- Sonoita, AZ
- Elgin, AZ
- Fort Huachuca, AZ
- Bourbonnais, IL
- Bradley, IL
- Aroma Park, IL
- Cerro Gordo, IL
- Hammond, IL
- Neoga, IL
- Buffalo, IL
- Gays, IL
- Ashmore, IL
- Trilla, IL
- Tuscola, IL
- Lovington, IL
- Stonington, IL
- Taylorville, IL
- Charleston, IL
- La Place, IL
- Forsyth, IL
- Mount Auburn, IL
- Argenta, IL
- Elkhart, IL
- Arthur, IL
- Humboldt, IL
- Lerna, IL
- Hindsboro, IL
- Melvin, IL
- Loda, IL
- North Salem, IN
- Ladoga, IN
- New Ross, IN
- New Market, IN
- Williamsport, IN
- Rossville, IL
- Alvin, IL
- Henning, IL
- Bismarck, IL
- West Lebanon, IN
- Hampton, IL
- Peru, IL
- Walnut, IL
- Marseilles, IL
- Arlington, IL
- Earlville, IL
- Malden, IL
- Sublette, IL
- Troy Grove, IL
- Eldridge, IA
- Utica, IL
- Sheridan, IL
- Yates City, IL
- Long Grove, IA
- Silvis, IL
- Mossville, IL
- La Moille, IL
- East Moline, IL
- Le Claire, IA
- Ottawa, IL
- Galesburg, IL
- Ladd, IL
- De Witt, IA
- Van Orin, IL
- Pleasant Valley, IA
- Harmon, IL
- Oneida, IL
- Lost Nation, IA
- Dahinda, IL
- Wyoming, IA
- Dixon, IL
- Alpha, IL
- Manlius, IL
- Dover, IL
- Ophiem, IL
- Wataga, IL
- Spring Valley, IL
- Mendota, IL
- Aledo, IL
- Cherry, IL
- Oxford Junction, IA
- Wyanet, IL
- Knoxville, IL
- Taylor Ridge, IL
- Sterling, IL
- Somonauk, IL
- Rio, IL
- Matherville, IL
- Moline, IL
- Carbon Cliff, IL
- La Salle, IL
- New Windsor, IL
- Reynolds, IL
- Andover, IL
- Henderson, IL
- Rapids City, IL
- Deer Grove, IL
- Buda, IL
- Dalzell, IL
- Ohio, IL
- Princeton, IL
- New Bedford, IL
- Grand Mound, IA
- Triumph, IL
- Rock Falls, IL
- Albany, IL
- Viola, IL
- Bettendorf, IA
- Amboy, IL
- Gilson, IL
- Donahue, IA
- Goodell, IA
- Lake Mills, IA
- Saint Anthony, IA
- Ellsworth, IA
- Laurel, IA
- North Miami, OK
- Commerce, OK
- Twin Oaks, OK
- Chelsea, OK
- Oaks, OK